Introduction
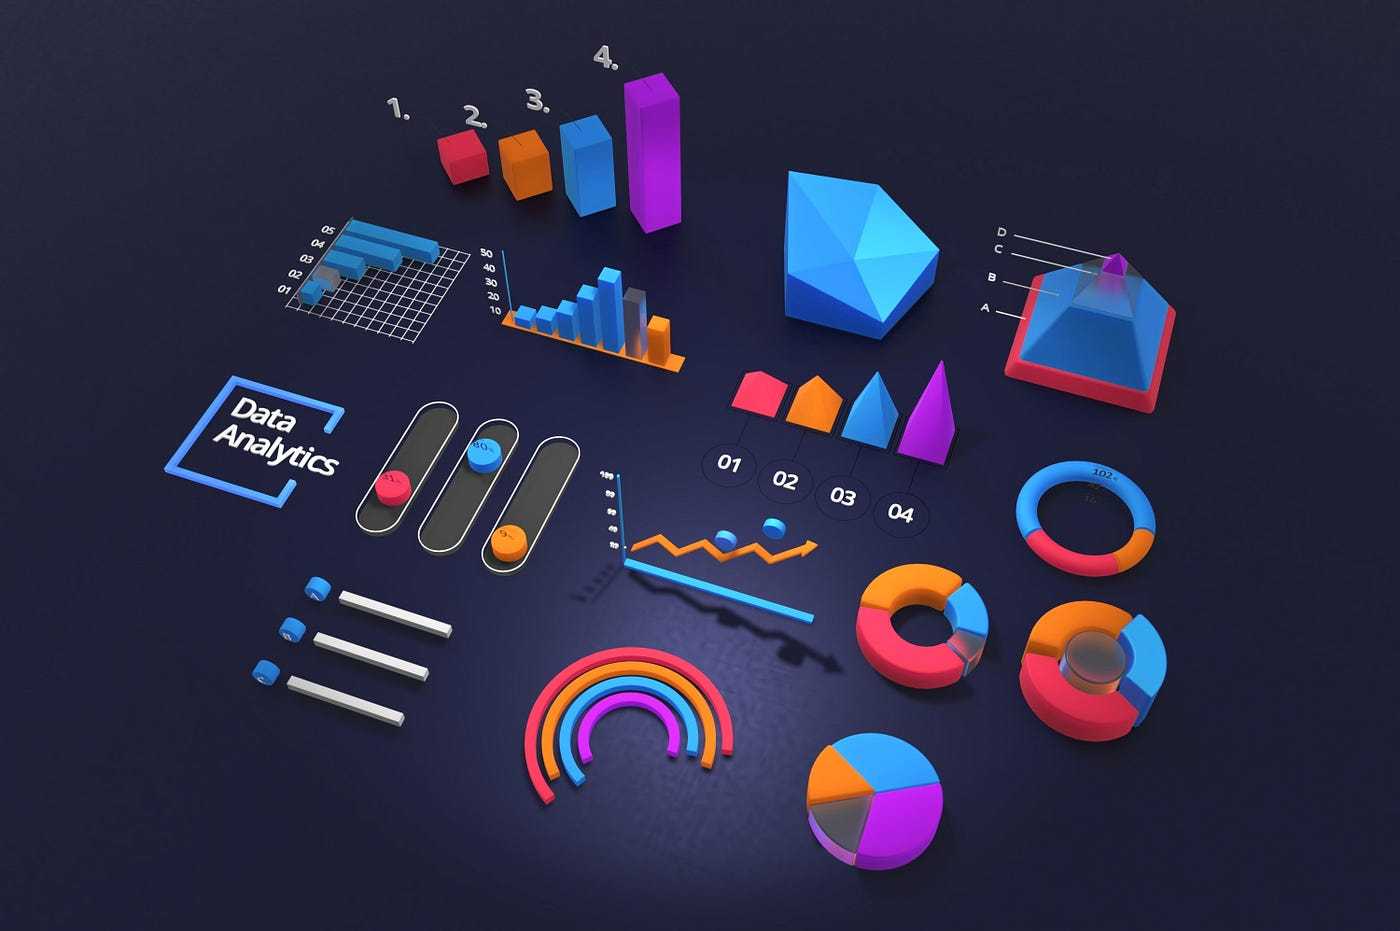
Today's information-intensive business environment is filled with gigantic sets of data. However, collecting data alone is not enough; it needs to be turned into meaningful insights to drive informed business decision-making. That's where data visualization solutions come into play. They help transform raw data into visual representations of complex information, enabling users to understand it quickly and make data-driven decisions confidently.
Data insights are invaluable assets for any organization, providing the foundation for strategic planning and operational improvements. But how do you measure the success of your data visualization efforts? Evaluating the Return on Investment (ROI) of these solutions is essential to justify the resources allocated and ensure they deliver tangible benefits.
Here's how to assess the ROI of your data visualization investments:
- Improved Decision-Making: One of the primary benefits of data visualization solutions is their ability to enhance decision-making processes. By presenting data in a visually compelling format, these tools empower users to identify trends, patterns, and correlations that may have otherwise gone unnoticed. Measure the impact of improved decision-making on key performance indicators (KPIs) such as revenue growth, cost savings, and customer satisfaction.
- Time Savings: Time is a precious commodity in today's fast-paced business environment. Data visualization solutions streamline the data analysis process, allowing users to extract insights quickly and efficiently. Calculate the time saved by employees in generating reports, analyzing data, and preparing presentations. This time can be reallocated to more value-added tasks, driving productivity and efficiency gains across the organization.
- Enhanced Communication: Effective communication is essential for driving alignment and fostering collaboration within an organization. Data visualization solutions facilitate clear and concise communication by translating complex data into easily understandable visualizations. Evaluate the impact of improved communication on project outcomes, team performance, and stakeholder engagement.
- Reduced Errors: Manual data analysis is prone to errors, which can have significant consequences for decision-making and business outcomes. Data visualization solutions minimize the risk of errors by automating repetitive tasks and ensuring data accuracy. Quantify the reduction in errors and associated costs, such as rework and corrective actions.
- User Adoption and Satisfaction: The success of any technology initiative depends on user adoption and satisfaction. Solicit feedback from users to gauge their experience with the data visualization solution. Assess factors such as ease of use, functionality, and responsiveness. High user adoption rates and positive feedback indicate that the solution is meeting the needs of the organization effectively.
By evaluating these key metrics, businesses can determine the ROI of their data visualization investments and optimize their strategies accordingly. Remember, the goal of data visualization is not just to present information but to empower users with actionable insights that drive business success. With the right tools and approach, organizations can unlock the full potential of their data and stay ahead in today's competitive landscape.
Revolutionize data visualization through iDataWorkers
Experience the transformative power of data visualization with iDataWorkers. Our cutting-edge solution empowers businesses to harness the full potential of their data, driving informed decision-making and delivering measurable results. With intuitive features, robust functionality, and unparalleled support, iDataWorkers is the ultimate tool for unlocking actionable insights and staying ahead in today's competitive landscape. Try iDataWorkers today and revolutionize the way you visualize and analyze data.
Further Reading
Unlocking the Power of a Trusted Analytics Platform
Data Democratization: Unleashing the Power of Insights for Everyone
5 Ways Data Fuels Growth: Master Your Business Analytics Platform
